The Outliers function is a specialized context calculation that generates a new custom column, calculating which data points in the query are statistically in or outside the bounds of the data set mean. This feature is particularly useful with used with scatter, bubble, and bubble map charts. But - it can be used and applied in all visualizations to separate the "ins" and the "outs". It provides a simple way to sort data into in and outlying clusters, making it easy to locate in-liers or outliers.
Note: the Categorize - Outliers function sorts data points by a single given measure, rather than all measures.
Note: Outliers from Discover are not supported on MS OLAP, Tabular, and SAP BW data sources.
Note: Advanced Analytical functions may not be available in your user profile.
Using the Outliers Function
To use the Outliers function, simply click the Outliers button (red) from the Query ribbon. A custom column called Outliers will be automatically added to the Color drop zone, and to the Dimensions panel (orange).
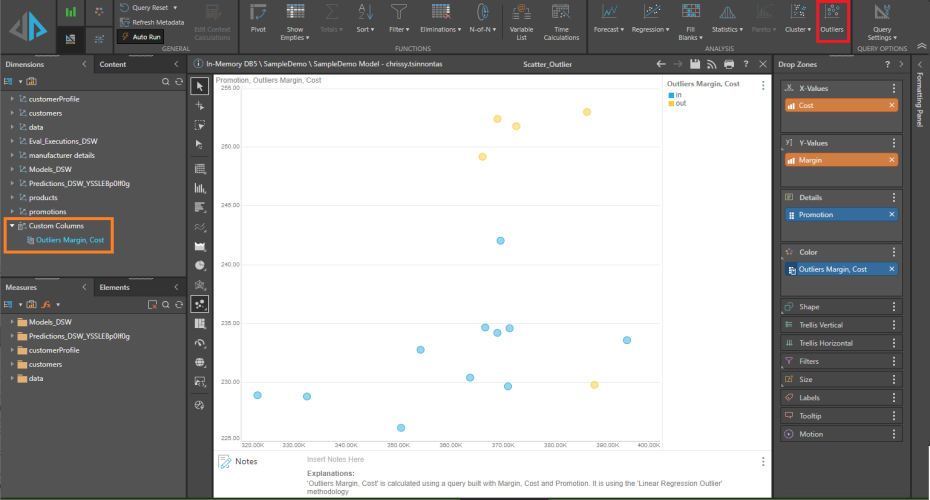
You can view the custom column's elements (in the Elements panel), and interact with its members ("in" and "out") to perform further analysis.
Removing Outliers
The outlier logic produces a specialized hierarchy (blue chip) that segments the query into the "in" and "out". To exclude outlier logic from your query simply remove the chip from the relevant drop zone.
Context Menu driven Outliers
Instead of using the ribbon outlier tools, you can also use the context calculation menus to build outliers on a given value (measure) chip. See here for more.
Outliers Logic
The Outliers function calculates the standard deviation of the current query's measure, to generate a new column contain two members: "in" and "out."
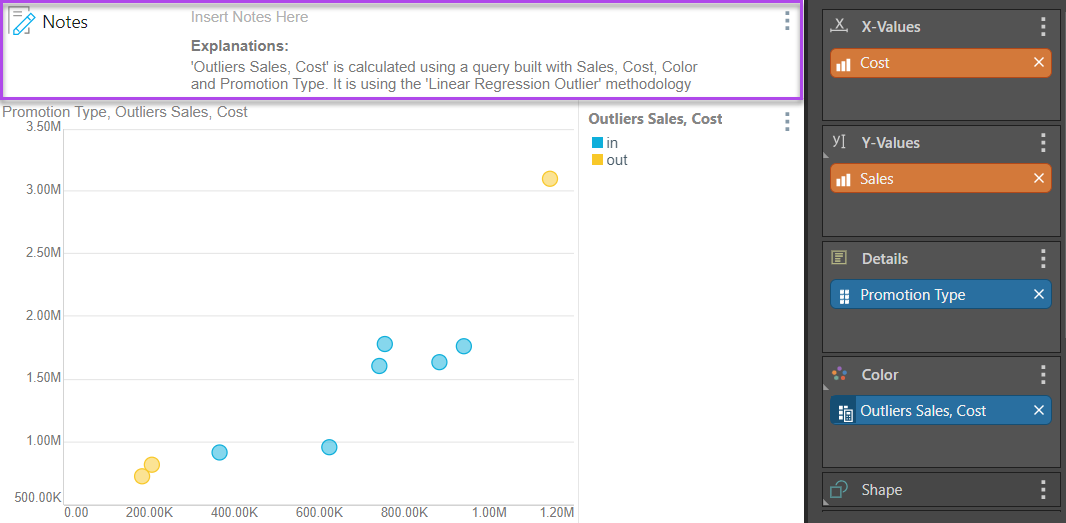
If the query contains 2 measures, standard deviation is measured against the regressed mean of the 2 measures. If the query contains more than 2 measures, the standard deviation is measured against the multivariate regressional mean. The Model tool offers other outlier algorithms that can be used instead as well as custom logic written in Python or R.
- For detailed descriptions of all the context PQL calculations, click here.
Explanations
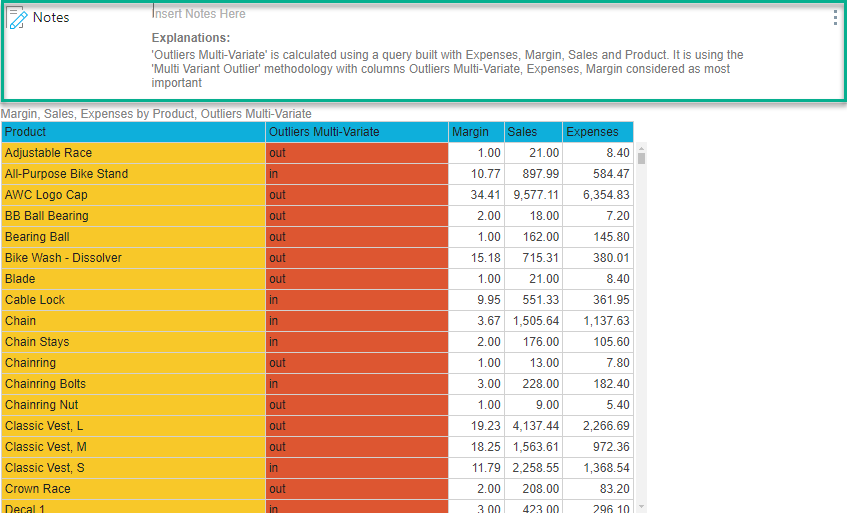
Applying an outlier calculation to the query auto-generates an explanation that you can show in your visual using the Notes tool. This explains how the outliers were calculated, which attributes were included in the calculation, and the outlier algorithm used.
When the Multi Variant Outlier algorithm is used to calculate the outliers, the explanation will also include a description of the most important attributes.
To view the auto-generated explanation, click Show Notes from the Design ribbon. The explanations can also be viewed downstream in presentations.
In the example below, the explanation describes how the outliers calculation was evaluated for the query:
In this example, the Multi Variant Outlier algorithm was used, and the attribute importance is described: